Dashboard Guide
1. Dashboard Overview
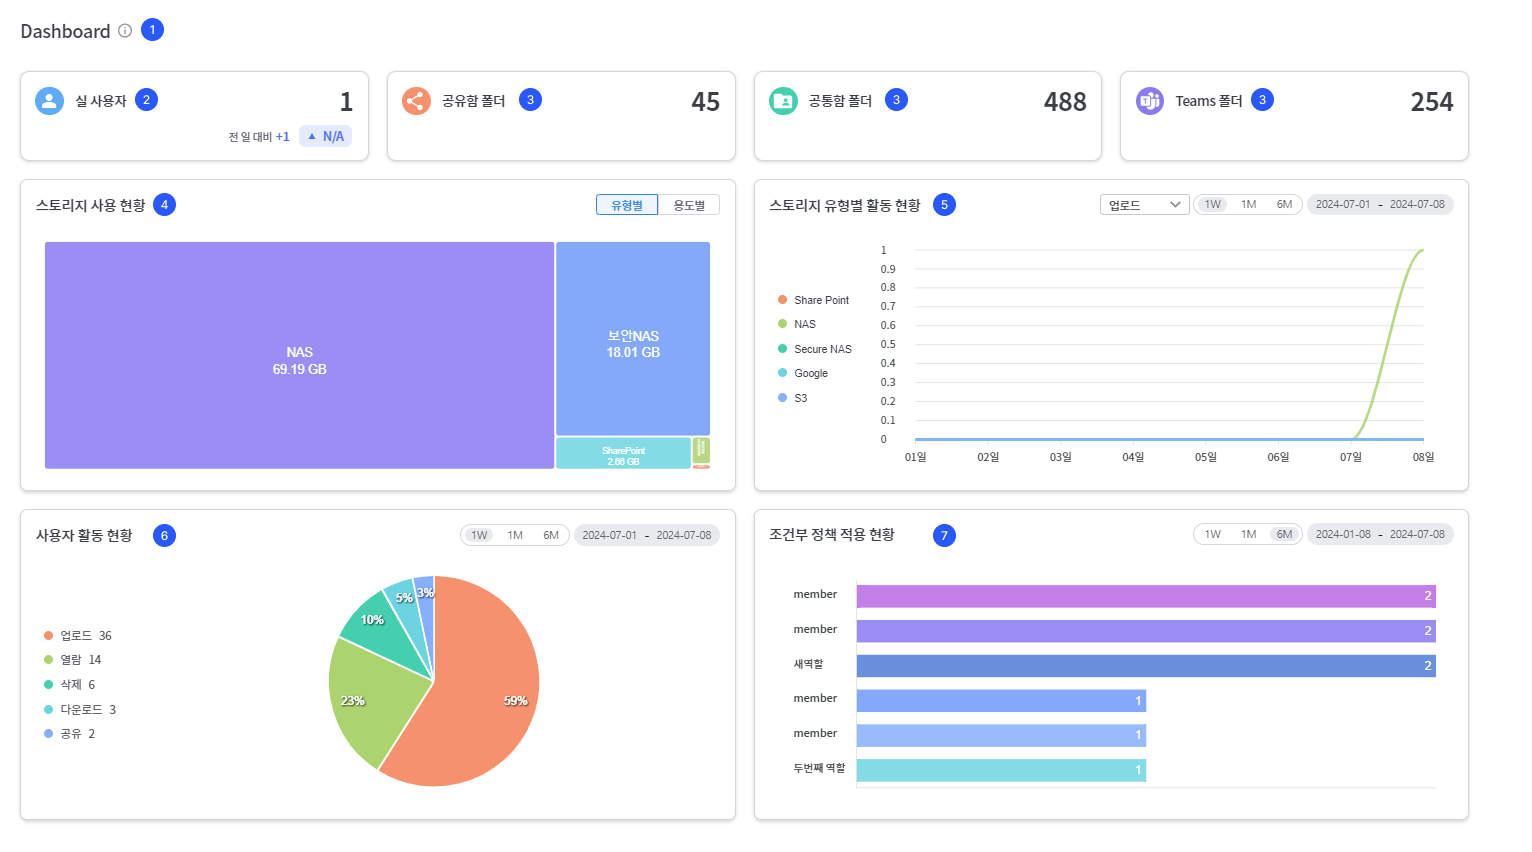
The SHIELDrive dashboard is a tool that allows you to grasp the system status and usage at a glance. It enables efficient monitoring and management of user activity, storage usage, and more.
2. Check the number of actual users
- You can check the number of users who actually executed the event.
- The change in amount and the change rate compared to the previous day are displayed together.
- If the number of users the previous day is 0, the growth rate will be displayed as 'N/A'.
3. Check the Number of Folders
| item | Explanation |
|---|---|
| Number of shared folders | Number of folders created in registered shared mailbox storage |
| Number of Common Function Folders | Number of folders created in the registered common storage |
| Number of Teams Folders | Number of folders created in Teams folder storage |
4. Statistics Chart (Storage Capacity / File Status / User Activity)
You can check the storage usage, file status, and user activity status in separate charts.
| item | Content |
|---|---|
| Storage Usage Capacity | Usage Capacity by Type and Purpose |
| File Status | Status of Uploading, Downloading, Viewing, Editing, Deleting, and Sharing by Storage Type |
| User Activity Status | User-specific event (upload, download, view, edit, delete, share) status |
- Query unit: 1 week / 1 month / 6 months, or set the period directly
- The query period can be up to 6 months, and if exceeded, the message 'You cannot query data beyond the data retention period.' will be displayed.
- If there are no records uploaded for the storage type, that type will be excluded from the table.
5. Check the status of conditional policy application
- You can check the trigger count for the registered conditional policies.
- The top 6 will be displayed in order of the most applied status.
- The query unit and period range are the same as the statistical chart.
6. Error Messages and Exception Handling
| Situation | Display Message |
|---|---|
| No data | 'No data exists' |
| Network Error | 'Failed to load data. Please contact the administrator.' + error code |
| Failed to load some data | 'Failed to load data. Please contact the administrator.' + error code |